01Challenge
01 / 02 · The business problem
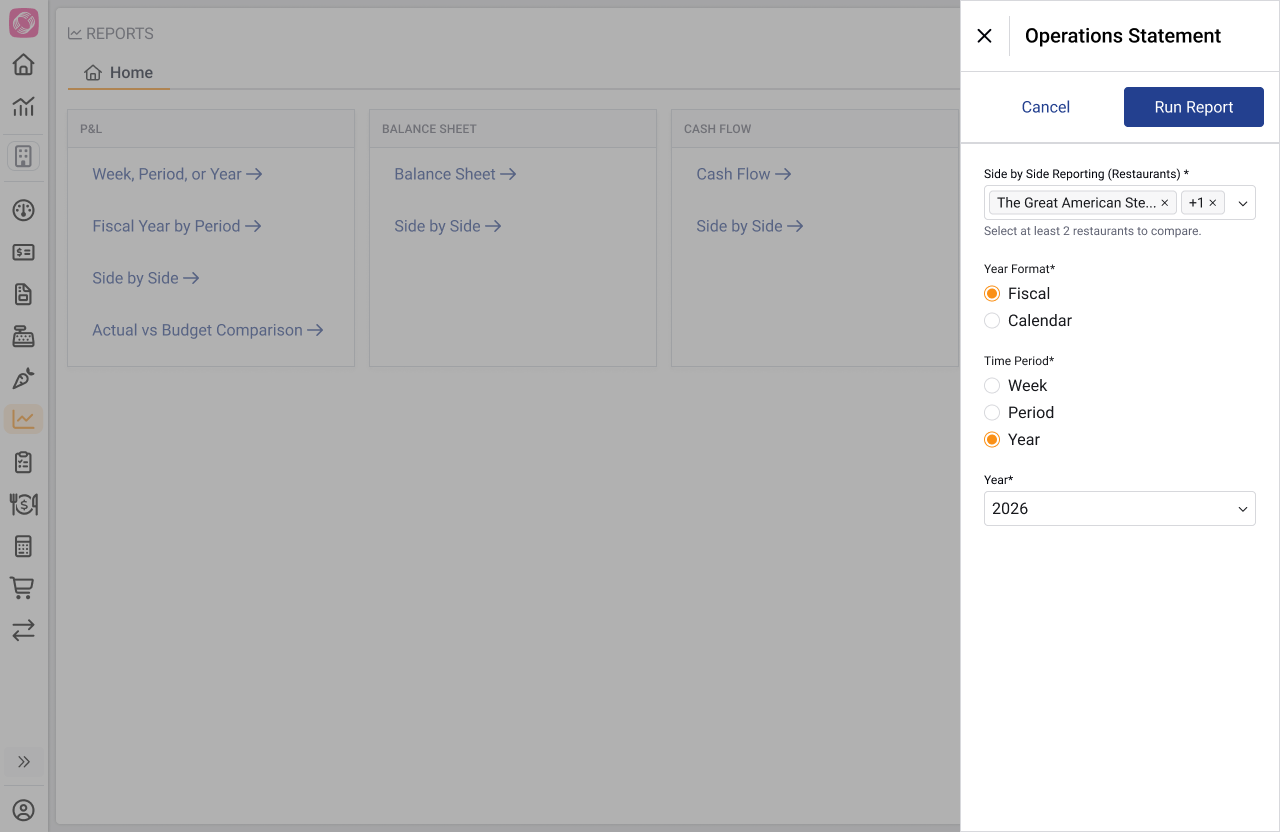
A migration, not a feature request.
Back Office's parent company acquired RASI, a restaurant-accounting platform, and needed to move its customers into one unified suite. The catch: Back Office couldn't yet run the multi-unit financial reports those customers depended on.
This was a business-driven feature-integration problem, with no user research behind it. The work had to:
Migrate without churn
Move RASI's operators into Back Office without feature parity. The risk was losing them.
Hold competitive parity
Competitors like R365 let operators run these reports natively, without spreadsheet workarounds.
Reach enterprise scale
Stretch from Back Office's smaller-operator roots toward enterprise volume and needs.
I had to think backward from the enterprise end state, even while shipping for single-unit operators first.
02 / 02 · The operator's reality
Reporting was built for single-unit locations.
Enterprise operators didn't need to know how one restaurant performed; they needed to compare dozens.
To answer that, operators exported every report and stitched the picture together by hand.
| A | B | C | D | E | F | G | H | |
|---|---|---|---|---|---|---|---|---|
| 1 | Loc 01 | Loc 02 | Loc 03 | Loc 04 | Loc 05 | Loc 06 | TOTAL | |
| 2 | Net Sales | 248,310 | 191,540 | 263,900 | 178,220 | #REF! | 142,880 | 1,329,960 |
| 3 | COGS | (71,540) | (56,210) | (78,400) | (52,100) | (88,300) | (41,900) | (388,450) |
| 4 | Gross Profit | 176,770 | 135,330 | 185,500 | 126,120 | 216,810 | 100,980 | 941,510 |
| 5 | Labor | (62,180) | (48,900) | (70,100) | (45,200) | (79,400) | (36,700) | (342,480) |
| 6 | Occupancy | (18,400) | (15,200) | (19,800) | (14,100) | (22,300) | (11,900) | (101,700) |
| 7 | Operating Exp | (29,900) | (23,100) | (31,200) | (21,800) | (35,600) | (18,400) | (160,000) |
| 8 | Marketing | (9,200) | (7,100) | (9,900) | (6,800) | (11,200) | (5,700) | (49,900) |
| 9 | Royalties (5%) | (12,420) | (9,580) | (13,195) | (8,910) | #REF! | (7,144) | (51,249) |
| 10 | Utilities | (7,800) | (6,200) | (8,400) | (5,900) | (9,600) | (4,800) | (42,700) |
| 11 | Repairs & Maint | (4,100) | (3,300) | (4,600) | (2,900) | (5,400) | (2,300) | (22,600) |
| 12 | Insurance | (3,500) | (3,500) | (3,500) | (3,500) | (3,500) | (3,500) | (21,000) |
| 13 | G&A | (15,600) | (12,400) | (16,800) | (11,900) | (19,200) | (9,800) | (85,700) |
| 14 | EBITDA | 13,560 | 5,940 | 12,205 | 6,310 | #REF! | 8,936 | 52,481 |
| 15 | Income Tax | (2,400) | (1,750) | (2,100) | (1,850) | (3,050) | (1,500) | (12,650) |
| 16 | Net Income | 66,290 | 47,930 | 64,400 | 45,020 | 79,510 | 33,980 | 337,130 |
02Architectural Decisions
Two architectural debates shaped the reporting system.
Debate 01 / 02
Balancing flexibility with comparability
Explored
Week, period & year together
This is already a side-by-side of many locations. Layering multiple timeframes would have added three or more columns per restaurant. At ten, twenty, or fifty locations the report collapses into noise.
Shipped
A single timeframe per report
One shared period across every location, chosen at setup.
Comparison only works when every column represents the same slice of time. A shared timeframe protects that consistency across every location.
Debate 02 / 02
Scaling comparison across growing portfolios
Proposed
A limit on locations
Cap the number of restaurants in one comparison to keep the layout readable.
Shipped
No cap
Internal stakeholders pushed back: a cap would solve a layout worry by creating a real operating limit. Compare as many locations as the operator actually runs.
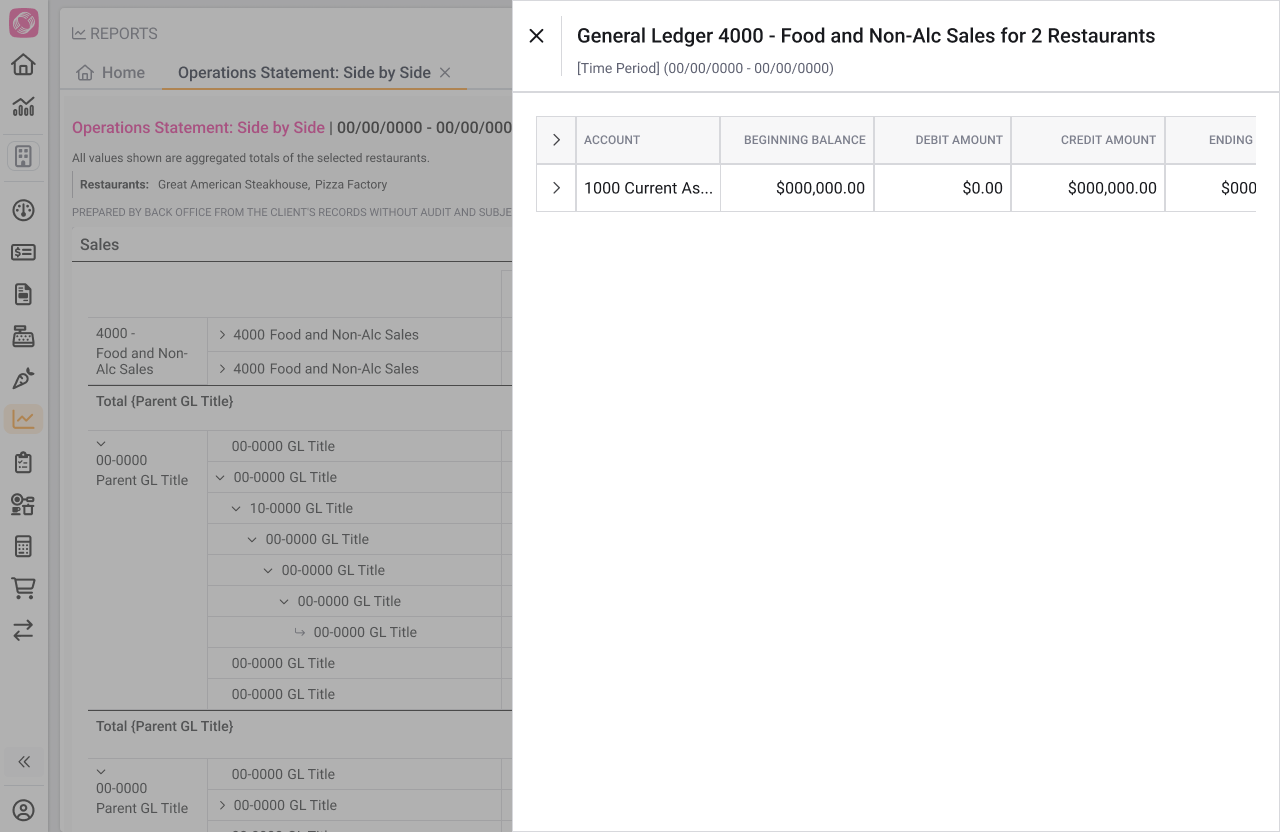
Rather than limiting scale, we designed the reporting system to remain understandable as portfolios grew: consistent columns, an aggregate view, and scoped drill-downs replaced an artificial cap.
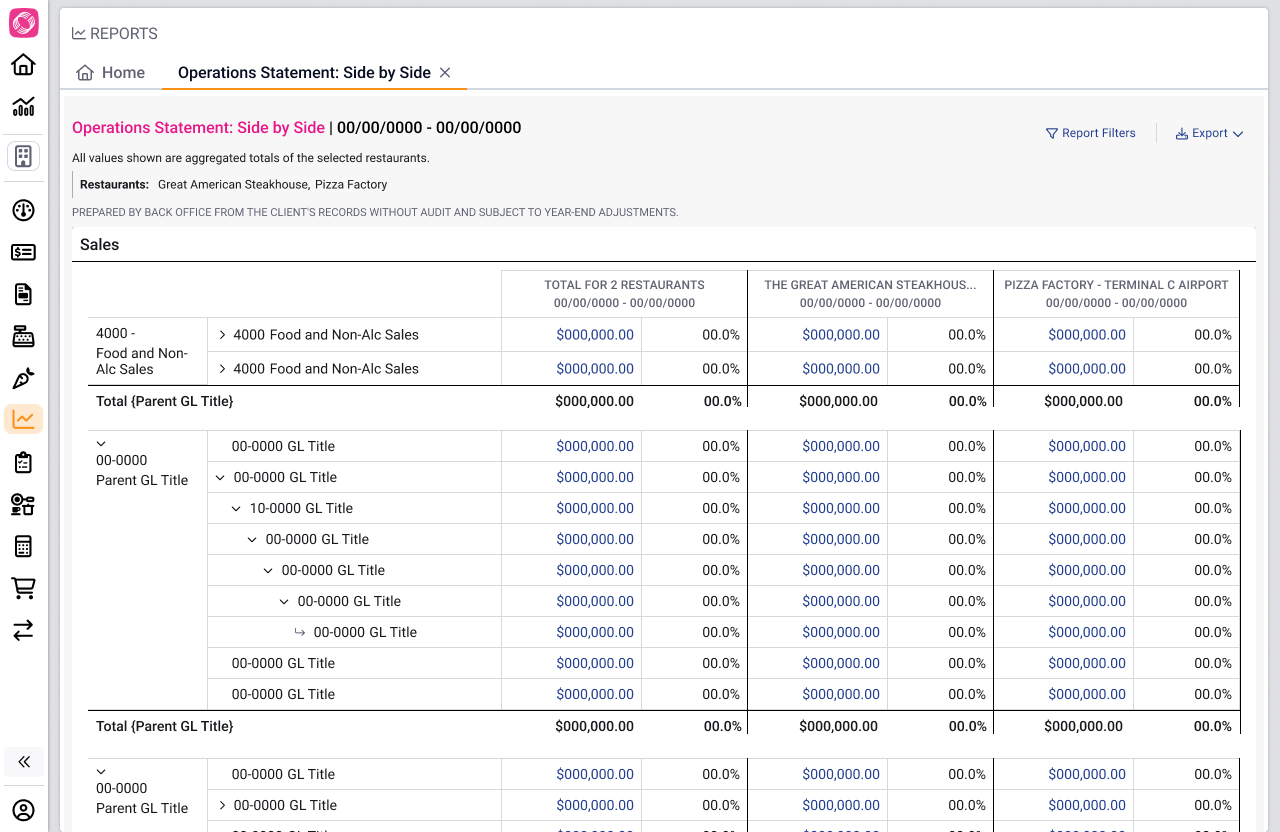
03The System
The problem wasn't a missing report. It was a missing reporting system.
These weren't four versions of one report. A P&L (Profit & Loss) tracks performance over a period, a Balance Sheet a moment in time, Cash Flow the money moving, the Operations Statement the day-to-day drivers. One interaction model had to hold across all four.
The shift
Before
40
reports, stitched by hand
After
4
side-by-side reports
How can operators choose which restaurants to compare?
I designed a shared interaction model for every multi-unit financial report.
04Impact
The reporting system became the foundation for enterprise reporting.
faster to compare locations across a portfolio
existing operators it brought multi-unit reporting to
more financial reports later built on the same framework
It also brought Back Office to parity with RASI, the platform many operators were migrating from. That protected those migrations and reduced the risk of churn.