01Challenge
Plenty of feedback. Not enough signal.
GearFit helps the U.S. Air Force identify equipment issues affecting aircrew safety and mission readiness. Its data informs funding and policy decisions across the Human Systems Division and Congress.
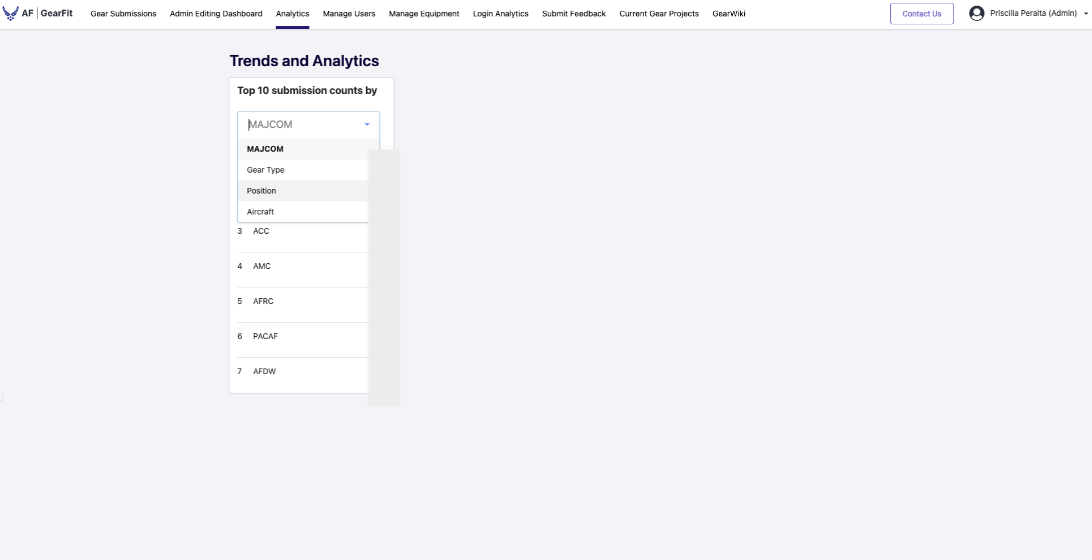
The existing analytics page showed only the top 10 submission counts by category, forcing program managers to review individual reports and manually identify patterns, assess severity, and prioritize issues. Prioritization was slow and reactive.
Key insight
Volume didn't equal risk. A frequently reported issue wasn't necessarily the most critical, while high-risk issues could be overlooked among individual submissions.
02Design Response
Making equipment issues visible and actionable.
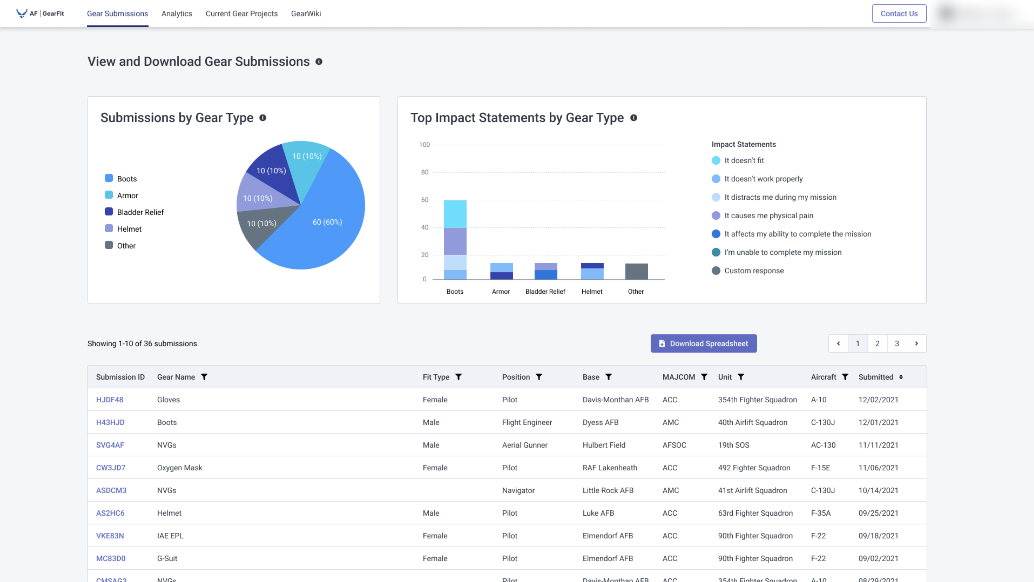
I proposed a scoped MVP that introduced GearFit's first data visualizations within the existing Gear Submissions page, bringing equipment insights into the workflow stakeholders already used.
Rather than relying on submission counts alone, I brought volume and mission impact together to help stakeholders distinguish widespread complaints from potentially critical issues.
Existing experience
Initial concept
03Key Decisions
Designing for comparison, not just visibility.
User feedback shaped three decisions that made the initial concept easier to interpret and more useful for investigating equipment issues.
What changed
Graph readability
Replaced the pie chart with horizontal bars.
User testing revealed difficulty comparing proportions across gear types.
Information prioritization
Focused on the 5 most-reported gear types.
Grouped the remaining 100+ possible gear types under All Others to keep comparisons manageable.
Interactive filtering
Connected existing table filters to both charts.
Stakeholders could investigate patterns by gear type, date, and other attributes.
04Impact
From reactive reporting to proactive prioritization.
GearFit's first visual analytics experience gave program managers a way to identify patterns, compare mission impact, and prioritize equipment issues without manually analyzing individual submissions.
Data quality & usability
improvement from visual analytics
Serving
Aircrew personnel using GearFit
“This does all of my [analysis] work for me now.”
AFE Manager · Air Force
“This would really help me with the gear program I'm working on right now.”
Requirements Manager · Air Force
Looking ahead
I advocated for expanding analytics across roles, bases, and units to help stakeholders identify systemic issues before they escalated.